Last updated on June 20th, 2025 at 04:47 am
You can read step by step process of recording web test plan in jmeter in my post about how to record test plan in Jmeter. After completion of test plan recording, you need to run your test plan to measure performance of application and how it behaves when multiple concurrent users accessing specific page or request. Before running your test, you need Set properties in Thread Group element (Load Profile Settings) and need to insert some new elements in your test plan to perform load testing and recording its results.
Adding Listeners in Apache Jmeter Test Plan
Listeners in Jmeter are very useful elements and are used for showing results of your executed test plan samples. There are many different types of listeners available to show results in Table, Tree, Graph or only log file and you can add any of them as per your requirement. After Recording and Thread Group property setting in Jmeter, You can add listeners into your web test plan as bellow.
Right click on Thread Group and select Add -> Listener -> Aggregate Report
Right click on Thread Group and select Add -> Listener -> View Results Tree
In bellow given image, i have added “Aggregate Report” and “View Results Tree” listeners. You can add any other too as per your requirement.
Run your web test plan
After setting thread group properties and adding listeners, You can Run your test plan.
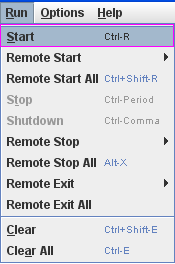
To run your test plan, Select Run > Start from Jmeter main menu as bellow.
Once you click on start button, Jmeter will start loading users(Specified in Thread group properties) to execute test plan. See Bellow Image. In Top-Right corner, it is showing 2/7 with green signal. Green signal indicates that your test is in process and 2/7 indicates that currently 2 users are executing test plan from total 7 users. When test plan execution will finish, Green signal will disappear and it will show 0/7.
View Results Tree Listener
In “View Results Tree” section, Some requests are display with green color and some are display will red color. Green requests indicates that request is executed successfully and becomes pass. Red requests indicates that there was appear some error during execution of request and it becomes fail.
Aggregate Report Listener
Same way you can see aggregate report in table view as bellow. There are many parameters available in aggregate report like No of samples executed, Average time of execution, Median time of execution, 90% line, Minimum time of execution, Maximum time of execution, etc..


2 thoughts on “Apache Jmeter – Running Your First Web Test Plan Steps”
Jmeter has avid roam for the customization. It can be customized easily as off-site developers can easily alter and add plug-ins according to their needs and requirements.
Hi, Can you please let me know why it is not recording in latest verison of Firefox and JMeter 5.0.0 version?